Gaussian Filter modifies the input data by convolution with a Gaussian distribution. Gaussian filter is often used to smooth out images.In this post i will try to show the frequency response of Gaussian filter. It is very important to understand the frequency domain behaviorism.When we consider the frequency response of gaussian one diamension filter we can see that , the filter reponse is inversely proportional to the frequency, lower the frequency, its response is high, that is more smoothing happens to lower frequency components.
An unnormalized Gaussian distribution is

where  is the standard deviation. This function is will form a belll shaped curve with center at 0. This function is non zero every where(high value at center and decreases ). curve is shown below
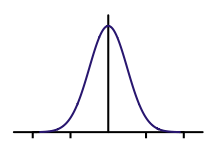
is the standard deviation. This function is will form a belll shaped curve with center at 0. This function is non zero every where(high value at center and decreases ). curve is shown below
A normalized gaussian distribution can be found by normalizing the above equation with the total area, which can be found by integrating it over -Infinite to +infinite.

so the normalized equation is(from wiki) : 
Frequency response of a 1-D Gaussian filter can be found by doing DFT over the 1-D kernel,
We can find it in mathematica simply with following commands
DftResults = Fourier[ Table[PDF[NormalDistribution[0,1],x],{x,-3,3,.01}] ];
ListLinePlot [ Abs[DftResults],PlotRange->All ]
This will plot the power spectrum of Gaussian 1-D filter. It will look like this (X axis-frequency,Y axis magnitude), we can see that at lower frequency level , filer gives better output.. the extreme right shows the nyquist frequency( ignore that for now. ). From this we can see Gaussian filter act as a low pass filter.

No comments:
Post a Comment